

The Information Lab and TravelTime bring you location intelligence tools for office relocation logistics
Moving to a new office is a significant investment. Many of these costs are visible up-front: leasing, utilities, insurance. However, there is also the potential for a business to impose a significant cost on its most important asset - the workforce.
Adding time or cost to an employee's commute will cause inconvenience and stress. The ultimate outcome may be reduced productivity, lack of workplace satisfaction, and resignation. Staff turnover leads to massive expenses in hiring and training costs for new staff, along with the less quantifiable loss of expertise and knowledge from departing staff. Analysing commute data can help businesses work out the potential impact of an office relocation on their staff, and assess the likelihood of staff turnover and rehiring expenses.
Let's take a look at how to assess changes to commute times.
To follow along at home, download the workflows here (you'll need to visit TravelTime to get a trial API key).
Building the analytics pipeline
Context
- A financial services company is looking to move to a new office location
- The existing site is in the City of London
- The proposed sites are to the east, in Canary Wharf, and to the west, in Chelsea Harbour
- The company needs to know the impact of moving on employee commute times and annual travel fare to assess the feasibility of the move
- A travel time matrix will be generated to compare the existing commute time and cost to each potential new site
Alteryx - generate employee travel times
- Read in employee home locations. Latitudes and longitudes have been pre-filled but could also be generated using the TravelTime geocoder tool
- Read in proposed new office sites. Latitudes and longitudes geocoded using the TravelTime tool
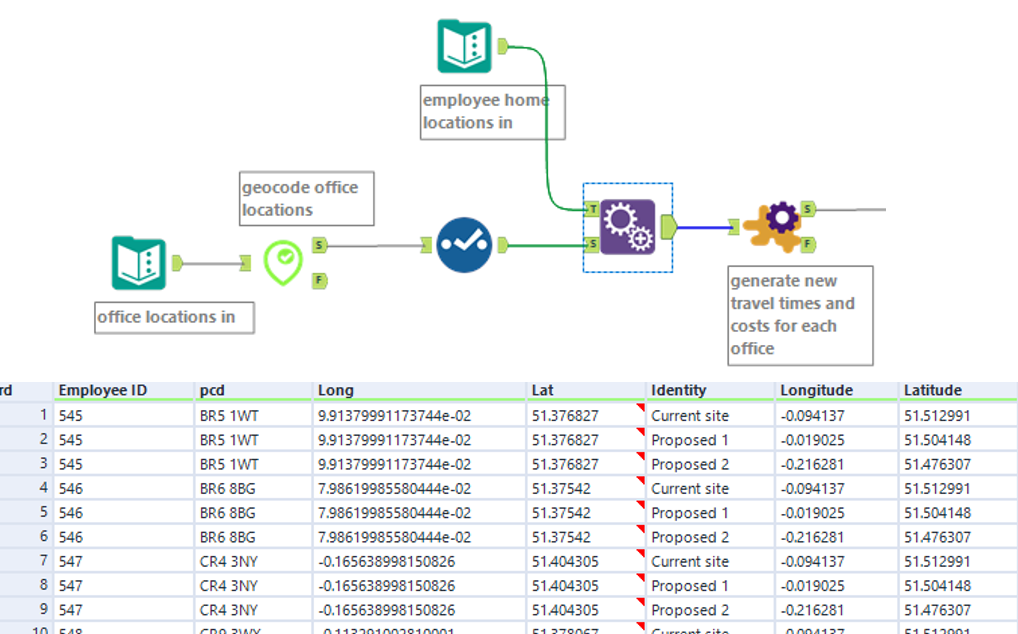
- Use the latitude and longitude of the proposed offices and employee home locations to feed the travel time matrix macro
- Specify a transport method (or multiple methods)
- Request fare data
- Configure date and time options (to arrive or depart by)
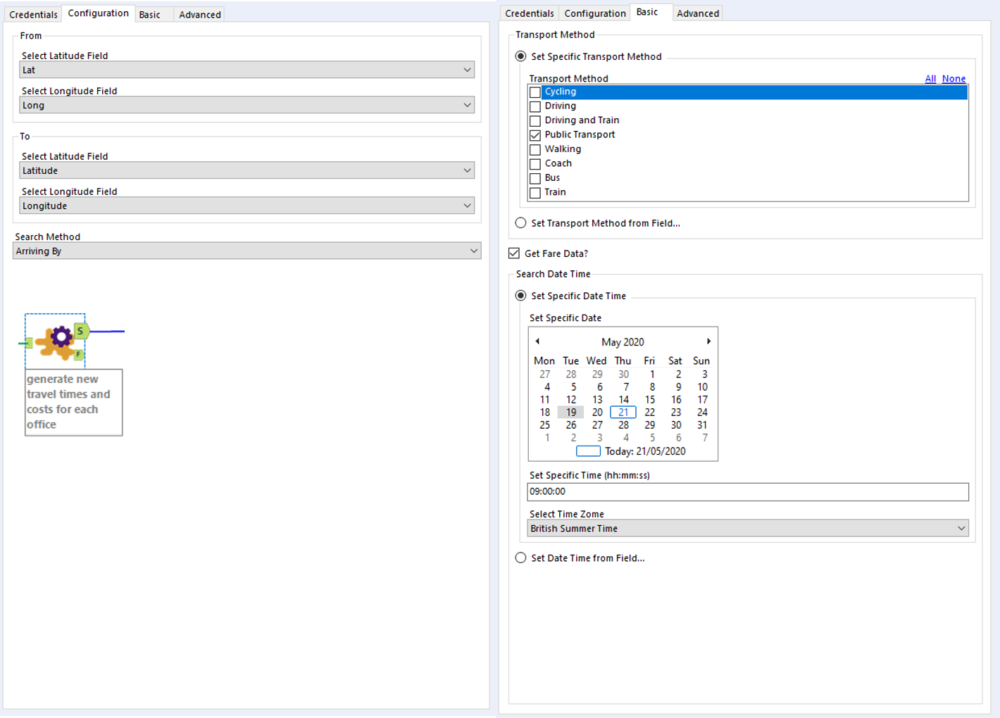
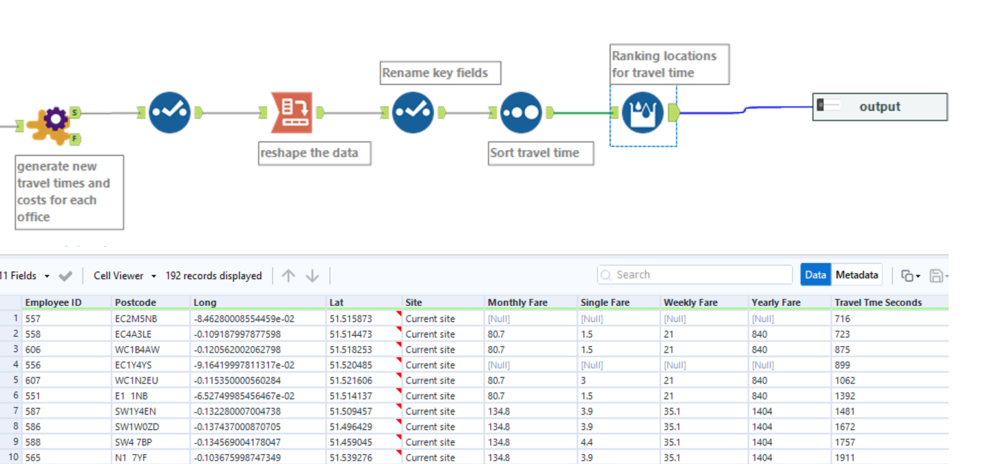
- The tool returns the specified fields of travel time (in seconds) and travel cost (in single, weekly, monthly and annual fare)
- The cross tab tool is used at this stage to reshape the data from 'long' to 'wide' with key metrics occupying their own column
Decision-making and Tableau
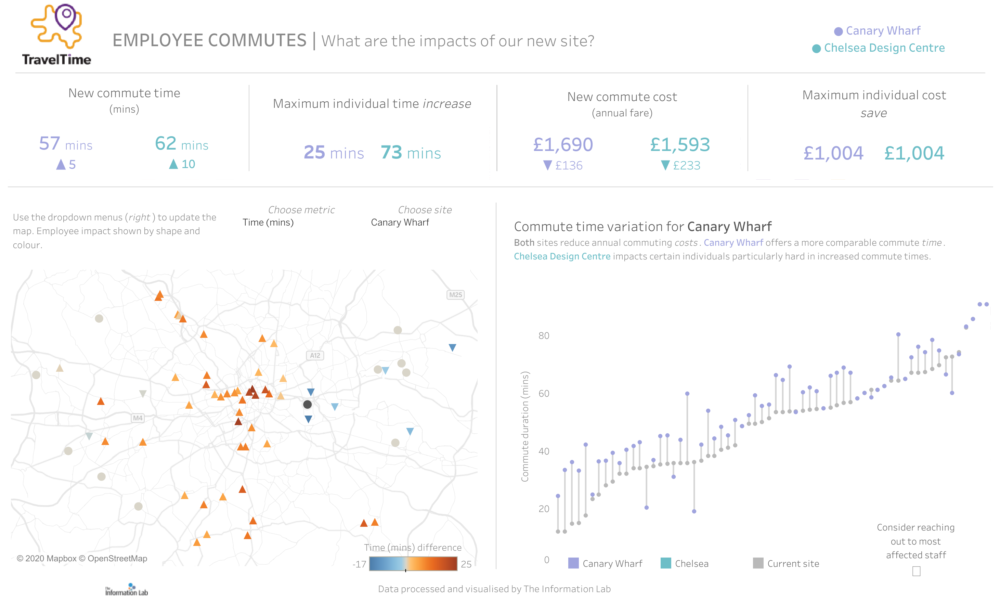
Alteryx provides an analytics team with the ability to quickly transform data from many sources into a single, consolidated output. Decision-makers need this output to be converted to easily digestible information in order to move forward; this is where Tableau excels. Here is a Tableau dashboard that helps you make the important business decisions:
Decision-makers can interact with this to make the right choices for their business. The top-level information shows the overall impact to staff, and it's clear that the Canary Wharf option is the better choice in terms of overall commute time and cost. The variation section shows the impact on individual employees to see how these impacts are distributed, and helps you identify who might be most likely to leave.
Interact with the Tableau dashboard here.
Next steps?
To download the TravelTime macros, visit the Alteryx gallery.
To get your free key to get the macros running yourself, register on the TravelTime website.
To download our sample Alteryx workflows, go to this location.
Feel free to engage with me (@AdiBop_) on Twitter to talk more about the TravelTime tools or all things spatial.