Ever wanted to build an org chart in Tableau or wondered if it was possible to make it interactive? Look no further! This blog will take you through the steps of building a dynamic org chart and point you to the templates you'll need to get started.
Before reading any further though, make sure you are using at least Tableau version 2019.2 – the drilldown functionality works off of parameter actions, first introduced in that version.
A bit of background first. I started playing around with this chart type after a frustrating session trying to get my head around a client’s org structure in WorkDay. The chart would open when I didn’t want it to and it didn’t keep context from higher levels of the hierarchy. So I set out to build a view where you could toggle from a whole org perspective (though filterable by team) to an interactive drilldown that could build on what I saw in WorkDay and hopefully engage stakeholders. This chart will also let you search for specific individuals and to highlight or filter by team.
You can also watch how I built the chart in this YouTube video.
As is often the case, there is a data prep stage before creating in Tableau. For this I used Alteryx, but I will describe the process in general terms here so that you can replicate it in your data prep tool of choice. I may in future release this data prep as an Alteryx macro, but no promises!
Step 1 – Download Jeffrey Shaffer’s template
I am grateful to Jeffrey Shaffer for making his work on node-link tree diagrams available to all. My work is an innovation on his pre-existing org chart that you can download here. The addition I made was to utilise the newer features of Tableau (parameter actions and animations) to make the chart dynamic. The logic of the branches and nodes remains unchanged. I used the org chart sheet in the template along with the pre-existing calculations there.
You can also download my template on Tableau Public.
Step 2 – Prep your data (pre-Tableau)
I suggest you first get to a point where you have a dataset whereeach row represents a branch of the chart. Further down the line, JeffreyShaffer’s Tableau logic draws the branch lines using the X/Y positions of thesebranches while the nodes are derived in table calculations that determine thestarts/ends of these branches. In short, don’t see the rows as the points ofthe org chart, but as the lines that connect them.
At the end of this step you should have a dataset whichcontains (at the very least):
- A unique identifier for the branch (this could be a description of thebranch such as Manager A to Employee B). I called this field ‘Branch’ and thisis the same as Jeffrey Shaffer’s ‘Category’ field.
- Start and end position (this will determine the X axis coordinates ofthe start and end of the branches)
- Start and end level (this will later be used to determine the Y axiscoordinates)
- A path field (more on this below)
I also recommend giving each node a unique ID number – I use this tocreate the path field later on.
Building the initial dataset
If you're dealing with a small dataset you can manually figure out the layout of the chart (the X and Y positions mentioned above). Because the chart will be dynamic, only 1 team can be opened at once. By team I mean all nodes that share a parent (i.e. all employees that share a manager). This means you don't need to worry about nodes overlapping one another and you can simply attribute X positions based on the optimal spacing relative to the parent. Eg: for a parent node at position 5, level 2 with 3 ‘children‘ - their positions could be 4, 5 and 6 on level 3. As a side note, this is why it was actually more difficult to build a static org chart - because I had to find a way to ensure that nodes were evenly spread out in such a way as to group them into teams on a given level, but also as close to their parent as possible. Personally, I automated this aspect of the prep using Alteryx.
The path field
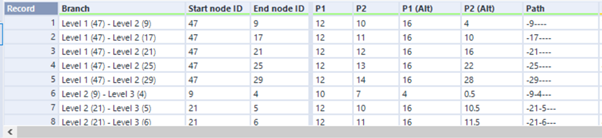
The path field is something I added to Jeffrey Shaffer’s template to enable the dynamic drilldown. It is a field that captures the path of the tree down to a particular point, like breadcrumbs. In the picture below, I am showing the path field for a sample of branches to illustrate how I built this field. These are all branches which pass through nodes 9 and 44, or whose ‘ancestor’ node would have had to pass through them.
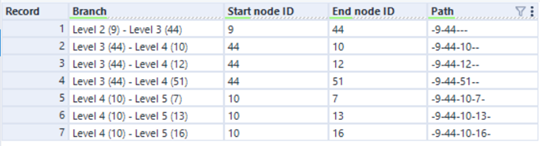
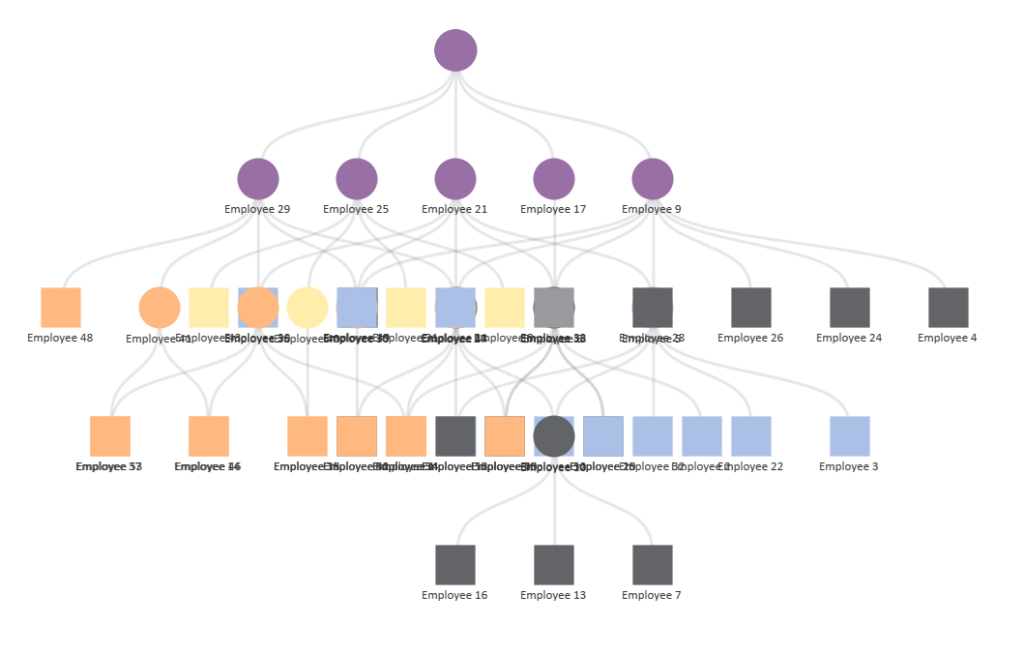
Here are the same records highlighted in Tableau. Node 9 is at the top of the highest highlighted branch.
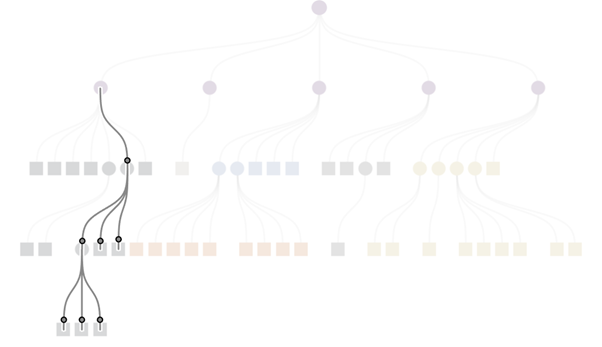
The bottom branch paths contain information about every nodethat has been passed through up until that point. Later on when we set up theparameter action to drill through the levels in Tableau, the fact that allparent nodes are stored in child nodes’ paths will ensure that earlier branchesdon’t disappear from the view.
The format of the path looks odd but it will be importantfor the functioning of the parameter. Note the same number of delimiters inevery row.
Finalising the dataset
Once you have all the bulleted elements in your dataset, youcan create the full dataset of individual coordinates that will create thecurved lines of the chart. These are the T and T2 fields from Jeffrey Shaffer’stemplate that constitute the individual coordinates of the curved lines. As described in hisblog, the T field can be created with a simple lookup table for each branch(your 1 row per branch table will then become 49 rows/branch). The T2 field isa little more difficult as it depends on the level of the branch. In Alteryx,once I joined to create T, I used the following row-level formula to create T2:[T]+(12*([Start node level]-1)).
You may also want to include other fields in this dataset such asemployee/manager names, teams, # of direct reports, whether they are a manager etc.You could also leverage Tableau’s relationships functionality to bring in thisinformation.
Step 3 – Amendments in Tableau
I won’t go into the detail of every step I followed to buildmy org chart, but you can unpick the detail by downloading the Tableau Publicworkbook. Instead I will focus on the steps to create the dynamic drilldown.
Creating the dynamic drilldown
The drilldown works by filtering out branches whose IDs donot match the pattern of the last selected Path field.
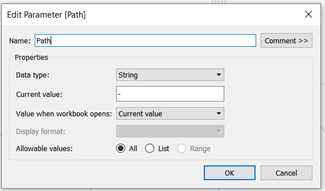
- First create a ‘Path’ parameter. Make sure it’s a string format, but no need to worry about the values since these will be updated through our parameter action.
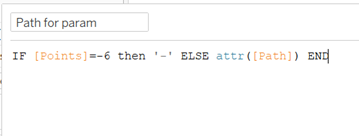
- Create a calculated field based on our existing ‘Path’ field. This will account for what happens if someone clicks the top of the hierarchy, which needs to be treated differently because of the way our data is structured. Add this field to detail to the Points chart. Only ‘T’ should be ticked in the ‘Edit Table Calculation’ window.
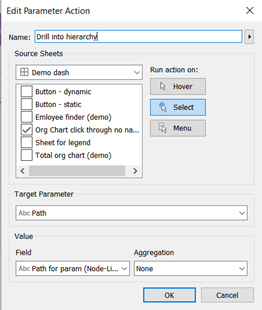
- Create the parameter action. The source is the sheet containing the org chart, the target the path parameter created in step 1, and the field used to update it ‘Path for param’ created in step 2.
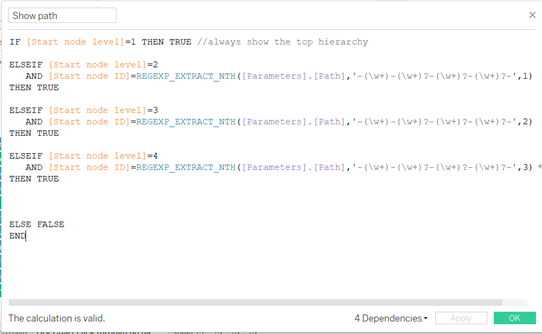
- Create a calculated field that will compare a given node ID with the value of the path parameter. The field uses RegEx to evaluate by level if there is a match. For instance, at start node level 2, we only need to check that the first target group - “(\\w+)” – matches the path. If the selected path is several levels down the hierarchy, the formula would still return ‘TRUE’ for the parent node. The delimiter-laden format of the path field creates a consistent structure for the RegEx pattern below. This calculated field would only work for a maximum of 5 levels (including the top node) but can be easily extended following the same pattern.
- Finally, add this latest calculated field to filters and tick TRUE.
Step 4 – Other considerations in Tableau
My example also contains some other features. The first ofthese was to make sure animations were turned on to create a smooth flowwhen drilling down.
Tableau’s default highlighting behaviour undermines the look and feel of the org chart drilldown in my opinion. Luckily, Seffana Mohamed-Ajaz has written a blog about how to counter this.
Dealing with overlapping nodes. The way the chart is built means parent nodes will have multiple marks on top of one another. Most of the time this won’t be an issue but if you want to create a chart with different colours and shapes these may overlap and look awkward. To get around this you will need to play around with the sorting order of dimensions in the marks card. Sorting based on node levels should go a long way to resolving this. I also minimised the size of marks I wanted to hide.
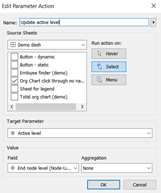
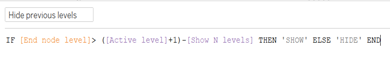
Hiding levels. For org charts with many levels, you may want to add the option to only show a certain number of them (in other words, top levels of the hierarchy would be hidden the more a user drilled down). To do this, create 2 parameters. One an integer where a user can specify the number of levels they want to see, the other also an integer but that will actually be hidden and dynamic based on the latest level that has been selected. You can then create a calculated field as below and add it as a filter to the view.
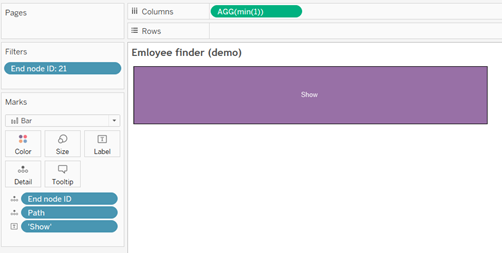
Employee finder. I’m not convinced I found the best way to do this in the version I published to Tableau Public, but I haven’t thought of a better way yet! I created a separate sheet that will act as a button with the path of a selected employee on detail. This path will update the path parameter as above. Add a filter to this view and make sure a user can only filter a single person at once.
An option to switch between the dynamic chart I described here and a static org chart. As I mentioned earlier on, I actually spent more time building the static chart because I wanted to automate the process of determining the positioning of the nodes. In any case, it can be useful to switch between views if a user wants a bird’s-eye view of the organisation.
You will probably need to create 2 separate charts with different node positionings to create the best effect. Without the filter that hides nodes not selected in the path, my org chart has overlapping nodes like this:
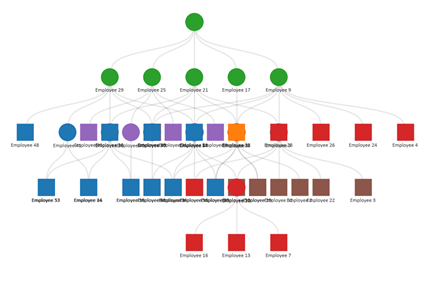
So I created a dataset with 2 position values for each branch: