

Introduction
There have often been use cases for users to be able to anonymise data, not filtering, for certain users on Tableau Cloud. From questionnaire data to sales performance, there are instances when you want to anonymise data and not filter it out. For example, if you’re collecting survey data for multiple external companies and you want them to be able to see their performance against the other companies (but understandably, can’t show actual values for the others), then you can use this technique to anonymise your data. The only supplementary data you’ll need is a lookup sheet of E-Mail domains or usernames related to data points you wish to anonymise. There are four caveats to this:
Your version of Tableau is at least 2020.3 or later as this requires using relationships. You can use blends, however the process works much more seamlessly using relationships
Your main data (questionnaire, sales etc) can be any form of connection, however it cannot be a published data source on Server/Cloud as, again, this process requires using relationships
The lookup companies MUST match EXACTLY to the companies in your main data set. For example if Donovan Enterprises is in the main data set, the lookup data set must match this
This is a unique match and a user cannot have access to more than one company data as this method uses a cartesian join. There is a way you can have someone (such as an admin) have access to all of the data, but this method is specifically used for external use cases. You can however have companies with more than one user or domain, as long as that user is only listed the once for that company

NOTE – The method for this working on both Cloud and Server is mostly the same with a few differences. The key differences are the set up and some calculations. This blog will be split out into the 2 different sections to be followed along easier for your Tableau set up.
Data
Here is an example of what your data may look like if you want to anonymise. The key thing here is that there must be an overarching category (company name for example) for you to be able to anonymise.
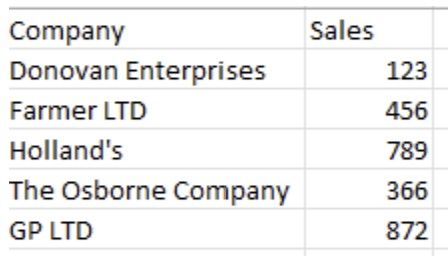
Tableau Cloud Setup
Please follow these set up instructions if you’re on Tableau Cloud. After the setup is complete, the anonymisation instructions will take place further down the blog. If you’re looking to set up on Tableau Server, scroll down further to see the “Tableau Server” section
Lookup Sheet Setup
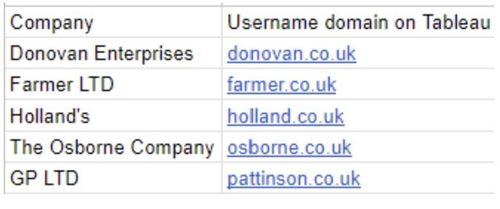
Google Sheet example of how to set up your anonymisation data
The company lookup dataset is set up so that any username with a specific domain is picked up. This alleviates the need to have every single user associated with that one company listed. All we need is all the possible domains that belong to that specific company, and need to see only that company’s data. If there is more than one possible combination you need (for example donovan.co.uk & donovan.com) that’s fine, you can have as many domains associated with one company as you like.
Connecting in Tableau – Relationship
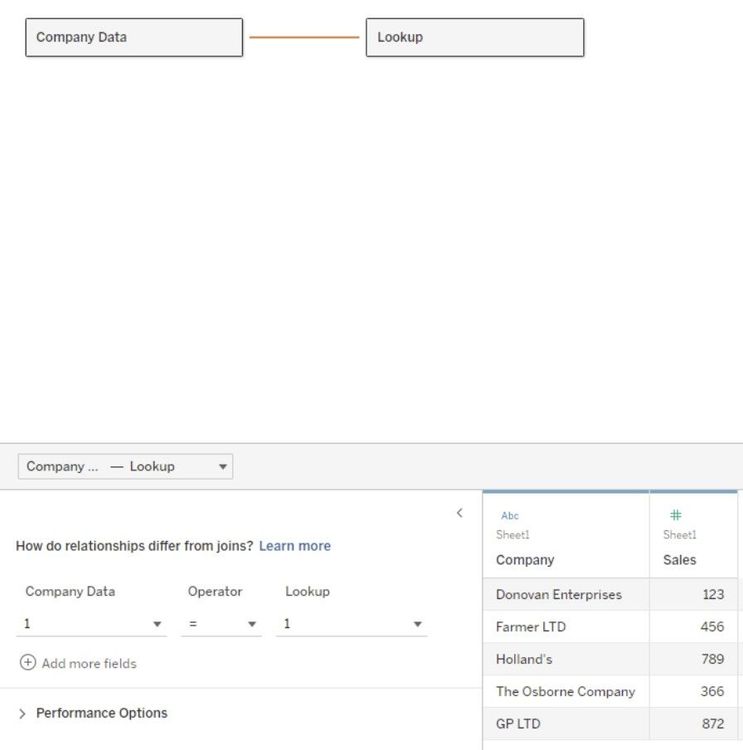
Once your company lookup is set up, all you need to do is relationship this lookup to your main data. This can be a local excel file, to a database connection. Your relationship condition needs to be 1=1. This will associate every single row in your company lookup table with your data table, effectively exploding your data, also known as a cartesian join. Don’t panic! We’re going to get around this by using a couple of calculations in Tableau so that only one row is actually used in the company lookup table. If set up correctly, your relationship should look something like this:

Return relevant row to user in lookup table
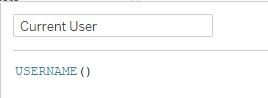
The next part is where we trick the company lookup to only bring through one row of data to relationship using a data source. This one row will be related to the person looking at the dashboard using the USERNAME() function in Tableau. Create a calculation called “Current User” to extract the domain from the active username. This requires a bit of regex but looks something like this
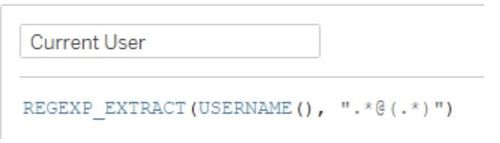
The result of this REGEX grabs you everything after the @ in your username. In this example, I am using an account on Tableau Cloud with the E-Mail address luke@donovan.co.uk. This should then correlate with a row in your company lookup sheet. The domain of the current user is donovan.co.uk and this is equal to a row in our lookup sheet and additionally, Donovan Enterprises
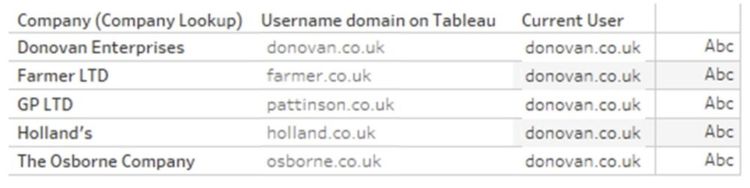
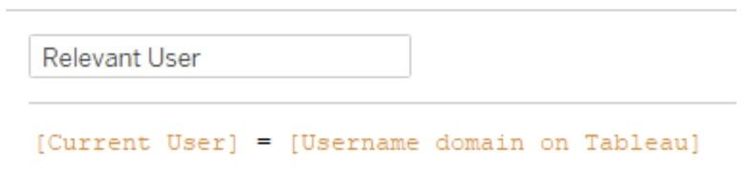
The first column is our company names to link onto our main data, followed by the specific usernames which should see that companies data. The last column is our “Current User” calculation which we’ve just created. We’re going to create a calculation called “Relevant User” which is going to test whether our current user field is equal to our username domain on Tableau field;

This brings back a boolean calculation which we can use as a datasource filter to only bring back one row. Pop this calculation as a datasource filter with True ticked and we’re almost there.
That’s the Setup done, scroll past the “Tableau Server Setup” section to go through the anonymisation piece.
Tableau Server Setup
Please follow these set up instructions if you’re on Tableau Server. After the setup is complete, the anonymisation instructions will take place below this section. If you’re looking to set up on Tableau Cloud, scroll up to see the “Tableau Cloud” section
Lookup Sheet Setup
For this to work on Tableau Server, you will need to list out all of the different usernames associated with the company you want them to be able to see.
Connecting in Tableau – Relationship
Once your company lookup is set up, all you need to do is relationship this lookup to your main data. This can be a local excel file, to a database connection. Your relationship condition needs to be 1=1. This will associate every single row in your company lookup table with your data table, effectively exploding your data, also known as a cartesian join. Don’t panic! We’re going to get around this by using a couple of calculations in Tableau so that only one row is actually used in the company lookup table. If set up correctly, your relationship should look something like this:
Return relevant row to user in lookup table
The next part is where we trick the company lookup to only bring through one row of data to relationship using a data source. This one row will be related to the person looking at the dashboard using the USERNAME() function in Tableau. You’ll just need the USERNAME() function and call this “Current User”
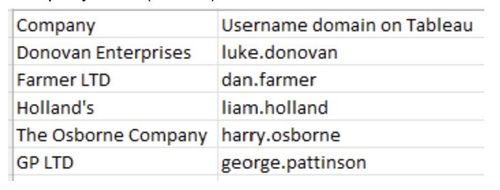
We now have a calculation which brings us back the relevant information for the specific user viewing our dashboard. For this example I am using an account on Tableau Server with the username of luke.donovan. We now need to filter our lookup table to only the relevant row specific to the user. Here’s what that looks like on a table:
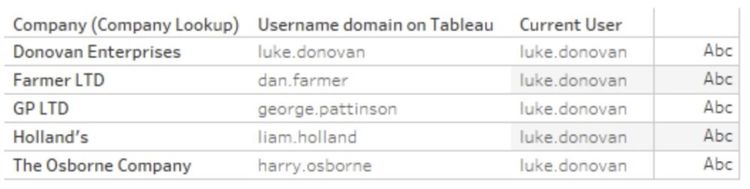
First column is our company names to link onto our main data, followed by the specific usernames which should see that companies data. The last column is our “Current User” calculation which we’ve just created. We’re going to create a calculation called “Relevant User” which is going to test whether our current user field is equal to our username domain on Tableau field;
This brings back a boolean calculation which we can use as a datasource filter to only bring back one row. Let’s emulate different users logging into our server and viewing our dashboard to see how this works.
Pop this calculation as a datasource filter with True ticked and we’re almost there
Anonymising the data
This section is relevant to both Tableau Server and Tableau Cloud
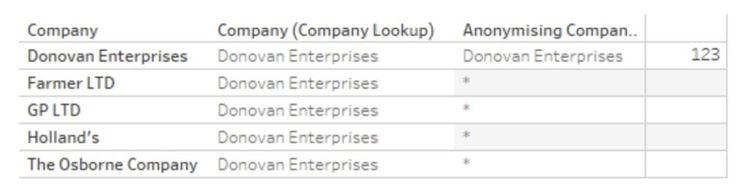
Let’s now bring in our main data, and the company data from our lookup sheet to see what we’re left with
We have our company data, the company relevant to the current user, and the sales values. This is where we start to anonymise our data. As you can see by the table, this is the reason it only works on a 1-1 match, it relies on 1 company in the lookup sheet being the same as the company value in the main data.
We need to anonymise the names and values of those companies which we shouldn’t be able to see. Let’s start with the names;
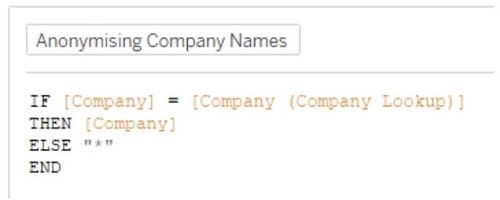
This will bring back a * for the companies not relevant to the current user. Next up, we need to anonymise the sales figures;
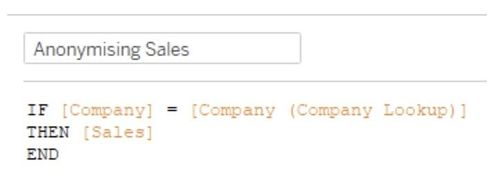
This will return a NULL for the companies not relevant to the current user. With those two calculations, our view now looks like this;
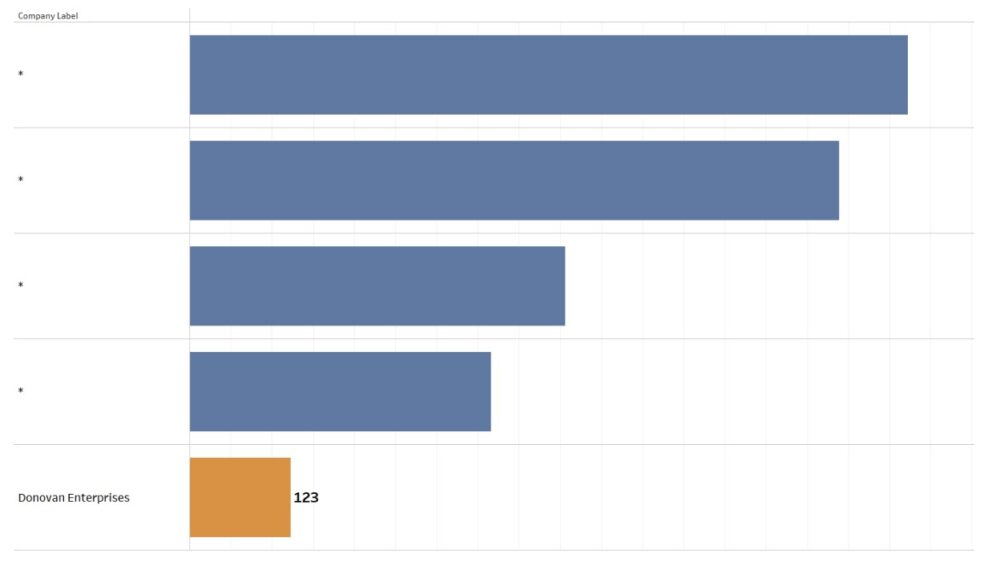
Our final step is to actually visualise this as a bar chart. In order to do so, we need to keep our original Company on the view, but just hide the header so the viewers can’t see. We also need the original sales figures to draw the bars, but use our anonymised sales calc as the text labels. Here’s a GIF of how to set it up;
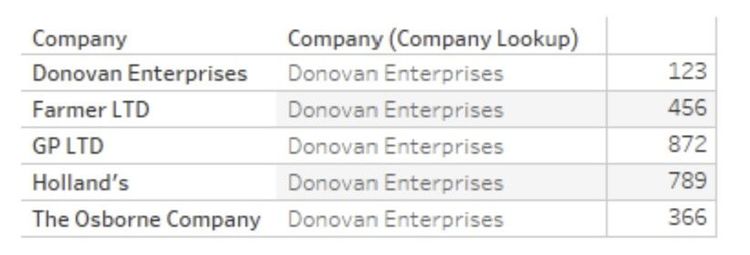
You can go one step further and create a calculation which highlights your relevant company with a simple TRUE/FALSE calculation of [Company] = [Company (Lookup sheet)] which would give you the end result of.
Security
In order for this to work, ensure the users don’t have permissions to web edit the dashboard to go in and edit the dashboard and see values they shouldn’t! Permissions are key here, it’s likely these people will just be viewers anyway but something to keep in mind. Also ensure your tooltips are anonymised either by removing entirely or formatting to your desired outcome. If you’re unsure around the permissions around this, please talk to your Tableau Server/Cloud administrators. If you’re putting this into production, please make sure you have carried out rigorous testing to ensure people shouldn’t see data they shouldn’t. This blog is just a guide and should be tested as rigorously as possible. As mentioned, these people will most likely be viewers, but in an ideal scenario these users should have no edit permissions on this workbook and it should be locked down as much as possible.
Conclusion
Here is a GIF emulating different people logging into the server to look at the dashboard. Feel free to reach out in the comments of this blog or E-Mail me at luke.donovan@theinformationlab.co.uk. Thanks for reading this blog and please let me know if you use this and helps you out in your business!