

Ask Data is one of those features Tableau put a lot of work into both to make it useful to end users but also to fend off competition from alternative BI tools. A few years ago there was a rush in the market with vendors needing to say 'we enable you to do BI using artificial intelligence and machine learning' in order to get a tick in an RoI rather than trying to explain why it wasn't necessary or that it was 'on the roadmap, we promise.'
Now Tableau wasn't the first to market with their solution and so when Ask Data launched with 2019.1 it had second-mover advantage. On the surface it is a really good implementation of a technology. Instead of trying to guess what the data worker wants to know or pretend it knows the data subject more than the experienced human Ask Data allows the user to ask questions of their data using natural language sentences to which it responds with the visual representations of the data Tableau is famous for.
So Ask Data should be a huge hit right? All the power of Tableau's in-memory data querying and VizQL powered charts without the need for 'pesky' drag and drop. All you need is a question and Tableau does the rest. But when all is said and done Tableau's Ask Data, along with many other vendors' solutions, has been a relative flop. People just don't use it...and I wonder if the reason has been under Tableau's nose all along.
You see Tableau started out with some brilliant innovations including their simple drag and drop interface, VizQL which allows them to query any supported database using simple visual commands and representations, and ever evolving in-memory data cache. One innovation which is frequently taken for granted is the uninterrupted user experience allowing end users to get into what Tableau calls 'analytics in the flow.' There are no wizards or dialogue boxes popping up as you move from bar chart to line chart, disaggregating here and adding colour there. While in the flow of analysis your concentration is maintained and you become a power data analyst discovering insights you never anticipated.
Ask Data however doesn't follow this winning formula. Let me take you through what I mean. Imagine that you are interested in understanding more about a new dataset you think could help you make better decisions. You have no idea where to start with it and so throwing a bunch of questions at Ask Data seems to be a great use case. After selecting the dataset on Tableau Server you see Ask Data listing all of the fields down the left hand side which is great. Before you can get started though you need to create something called a 'Lens'. Erm, excuse me a what now? I just want to ask Tableau some questions about this data, why do I need to create a Lens in order to 'customise Ask Data for specific users by selecting a subset of fields...and adding synonyms.' But I just want to mess around with this new dataset, why do I need to enhance its metadata before I can ask questions of if?
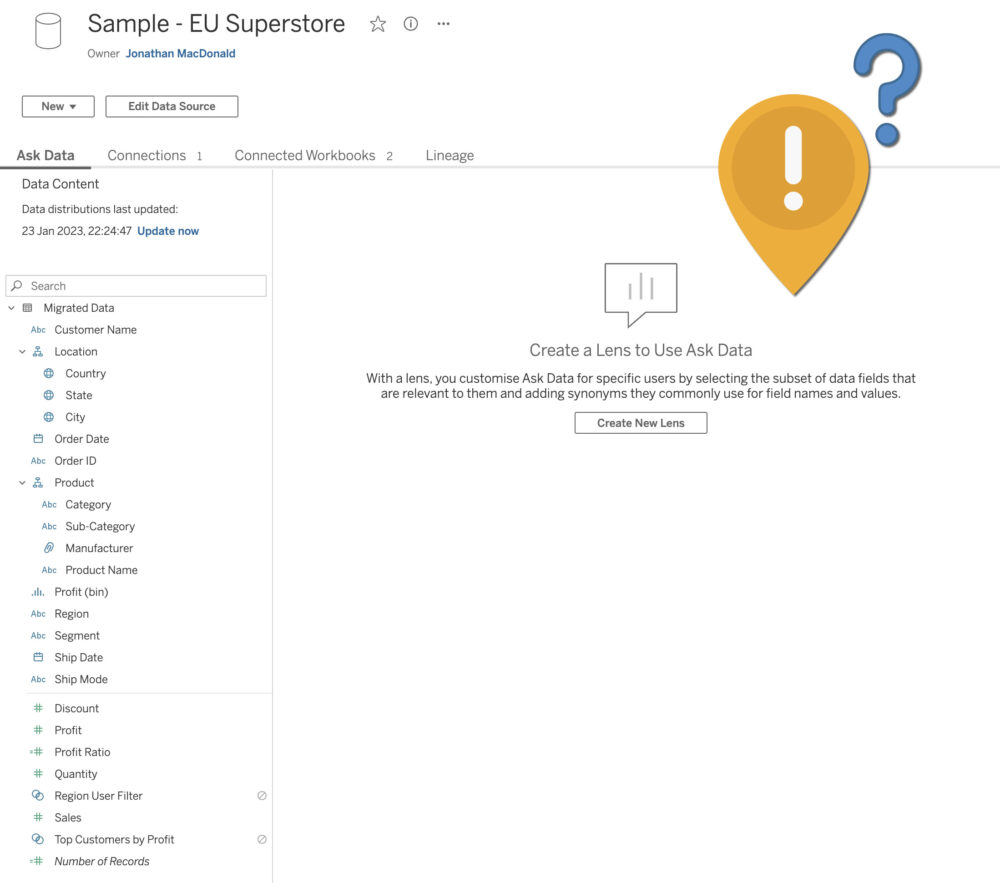
Get over it I hear you say, it is one button to create a new lens, not a big deal right? Wrong! Clicking it creates a new blank tab in the browser into which this lens loads asking the user to select some fields (thankfully all are preselected by default).
In that moment Tableau forgot one of its golden rules, don't get in the way of the analysis, keep the user in the flow connected with their data and allow the software to disappear. We had a screen which listed the fields we were excited to find some insight in. Why didn't we just start asking questions? Instead the new tab injected a harsh blank screen, the user has a sudden worry of 'what did I just do?' only to be presented with a dialogue box of all things where they have to decide which columns should be kept before they can get started with their analysis.
So we've hit one pretty big pothole but let us leave everything as default and hit the submit button. We can now ask a question! Yay, we are there. Let us ask our first question.
'Which states have the greatest total sales'
All looks good and personally I love the prompts that pop up as I type. It gives me confidence that Tableau is interpreting my question as I expect. Eagerly we press the enter key and...wait...the user interface has changed AGAIN! Yet another hard break, another full screen refresh. Yes we've made progress as we have our first chart and an answer to the question but...wait where's the question gone?
The prompt has cleared itself and left a few items above it which are supposed to explain what we're seeing. But we had a perfectly good explanation written in our own natural language. Why get rid of it? I'd also like to point out that this confusion is currently being experienced when the resulting visualisation gives us the answer we want. What if it didn't? How would we debug and figure out how to ask a more meaningful or accurate question?
So after asking just one question Tableau broke our flow of analysis twice and that doesn't even cover saving the viz only to find yourself back in the default drag and drop interface with no way back to continue with Ask Data.
The Solution
The good news is that Tableau know the solution to this problem, it is the same winning formula that helped propel their core interface to the top of the charts. Go back to fundamentals and remove any friction for the user moving through the interface. I am sure that lenses have their use case but it is for the data source owner to create and should be secondary to the core need of new user of that dataset to ask their questions.
The AI landscape has also recently seen the introduction and widespread success of ChatGPT, so much so that Tableau's competitor Microsoft has made a massive investment in the technology. Now while it's a little easier to make an AI solution which responds primarily with text which doesn't have to be 100% accurate rather than data visualisations which do need to accurately represent both the data and the question there are some aspects of the user experience Tableau could easily replicate. They are also answers to the problems we've explored above.
Most obviously ChatGPT is a single thread of questions and answers without any break in the interface, you can just keep exploring question after question without any visual break. There is also a full history of the session through which a user can scroll, reuse and tweak a question and ultimately build a full picture of information. Tableau should do the same with each question building a new visualisation and saving all previous questions and responses to their own tab. They could then add keywords or a button to indicate the user would like to build on and explore a response rather than start a new one.
Finally each session should be able to saved as either an Ask Data session and/or a Tableau Workbook allowing the user to come back to continue their exploration in any way they wish.
If I could have a wish granted for this area of Tableau I would go back to a blog I wrote 6+ years ago about where the Data Server could evolve to. Ask Data would not just be seamless in its user experience moving from question to answer to question but it would be seamless in the data that was being queried. Ask Data should be at the top of the Tableau Server interface as soon as you login ready and waiting for you to get the answers you need from your data, smart enough to select the right data source and free flowing enough that you can't stop asking more questions. But one step at a time.
What do you think? I'm sure there are many more reasons why Ask Data isn't a users first choice but getting the basics would help right? Find me on Twitter and LinkedIn to keep the conversation going.