

9 March 2016
**Original post is written by Federica Ferrarini. Reposted and edited by Emily Chen.Let’s say we have downloaded some tweets from the web and count the number of hashtags. We have a table like this: A field with the date, an ID field (id_str) a field about the language and a field with the text of the message and a field with the username. We want to create a classic table, like this:
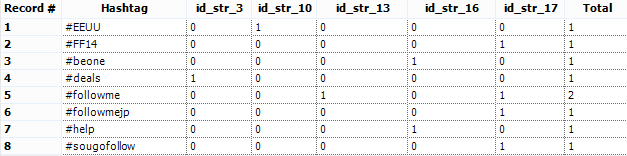 First thing we can do is to get rid of all the rows that don’t contain the hashtag symbol #.We can use a Filter Tool to find all rows which contain “#” using the Contains() function. The data will be split into 2 flows:
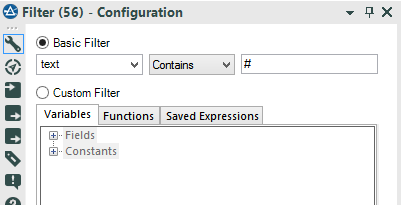 Our goal is identify unique hashtags and count its frequency. The next step is to isolate each hashtag.We can easily do this by using regular expressions, connecting the T connector of the Filter Tool to the RegEx Tool.Regular expressions (as the word itself describes) is a syntax that can identify patterns in strings and thus, useful for making strings recognizable for “regular” use. No matter the string of text, if you can find a pattern, you can build a regex expression.In our example, no matter what people wrote, each hashtag has the same pattern: #+word. Therefore, the goal is to find any word that starts with #.'Any word' can be translated into Regex as '\\w+' and '\\w' is any letter from a to z (upper and lowercase) plus the numbers plus the underscore symbol. + means one or more occurrences. However, the # is not a symbol used as regex operator (like the dot), so it can be used as is.The final regex string is: #\\w+ (one or more letter with a # right before.)The tokenize method “Split to rows” creates a new row for each hashtag found.
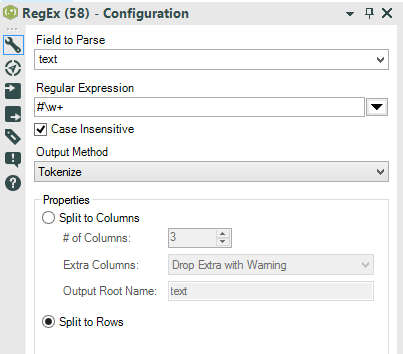 We are going to use the split to rows method for 2 reasons:
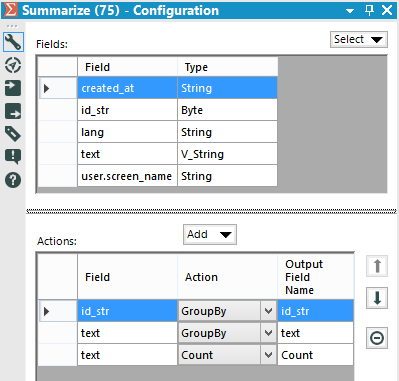 If we want to study how many times each hashtag is referenced, we need to count the hashtags.Summarize data grouping by id_str and text.And count the text field. The result:
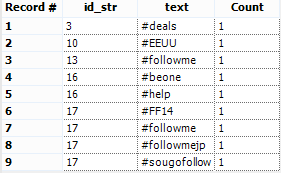 To calculate the totals of each hashtag, we’ll have to shape the data differently. This means preparing the cross tab separately and in the end we will join everything together. This requires us to split our workflow into 2 different ways.Let’s start with the cross tab table. We can just use the Cross Tab Tool.
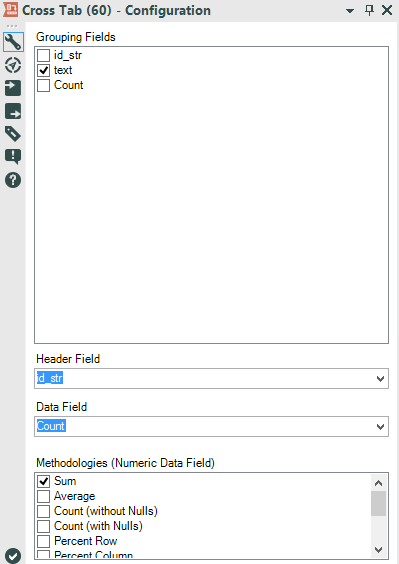 The Cross Tab Tool allows us to turn columns into rows.We have to choose which fields will be our Header Field (the labels of the columns) and which field will be our data field (the data inside the table).We also have to choose a method to join data in the data field.Our header is the id_str field and the data is the count field we created with the summarize tool.The method is Sum, because we are handling with numbers and we want to find the frequency.There is also an option to group the data. We need to group by text, in order to get our list of hashtags.The result is a table like this:
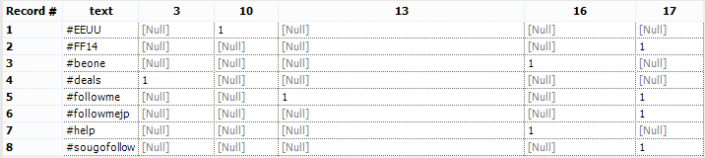 Now we have 2 problems:
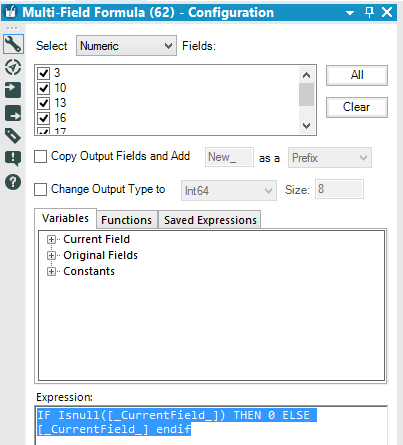 We can use a Multi Field Tool to replace the Null values in each numeric field.While the Formula Tool allow us to choose only 1 column, the Multi Field Formula allow us to choose one or more columns and perform the same formula/expression everywhere.We are going to flag all the numeric field, manually or choosing Numeric from the drop down menu.The formula is: IF Isnull([_CurrentField_]) THEN 0 ELSE [_CurrentField_] endifIf a cell has a null value, replace it with 0 - else return the real value of the cell.Now we have to clean up our ID fields.
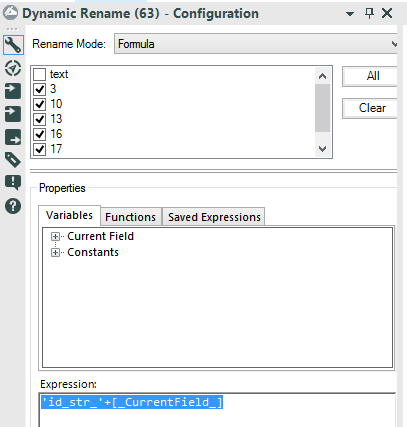 Let’s drag and drop a Dynamic Rename tool from the Developer tab to the canvas.We need a formula to fix the column labels. Choose Formula from the drop down menu and select all the field that need to be renamed.We have to add the missing string before the number: 'id_str_'+[_CurrentField_]
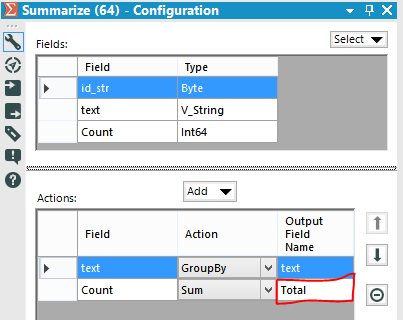
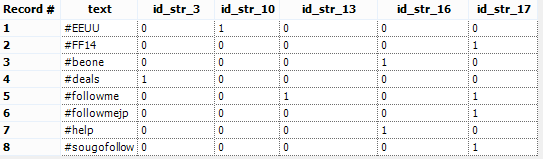 Now we can create our totals. Drag and drop a Summarize tool to the canvas and connect the first Summarize tool we used earlier to the new Summarize tool.We only need to group the data by text and sum the count field. We can also rename the Sum_Count field in Total, directly in the Summarize tool.
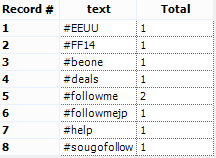
 We have 2 tables with 8 rows and the same hashtag in the text column. We can join the tables using the Join Tool and using the field text as common field:
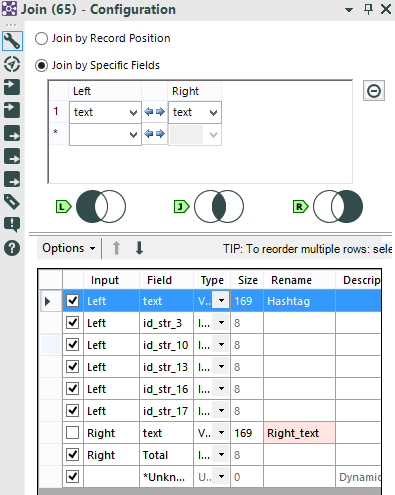 and Voila-- our tweets and totals!
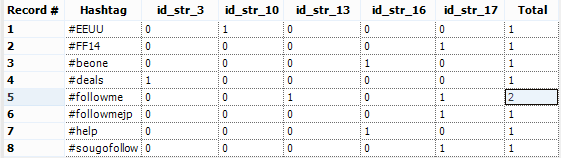
A field with the date, an ID field (id_str) a field about the language and a field with the text of the message and a field with the username. We want to create a classic table, like this:First thing we can do is to get rid of all the rows that don’t contain the hashtag symbol #.We can use a Filter Tool to find all rows which contain “#” using the Contains() function. The data will be split into 2 flows:- the T connector (True) will output all messages containing the # symbol
- The F connector (False) will output all the messages not containing the # symbol.
Our goal is identify unique hashtags and count its frequency. The next step is to isolate each hashtag.We can easily do this by using regular expressions, connecting the T connector of the Filter Tool to the RegEx Tool.Regular expressions (as the word itself describes) is a syntax that can identify patterns in strings and thus, useful for making strings recognizable for “regular” use. No matter the string of text, if you can find a pattern, you can build a regex expression.In our example, no matter what people wrote, each hashtag has the same pattern: #+word. Therefore, the goal is to find any word that starts with #.'Any word' can be translated into Regex as '\\w+' and '\\w' is any letter from a to z (upper and lowercase) plus the numbers plus the underscore symbol. + means one or more occurrences. However, the # is not a symbol used as regex operator (like the dot), so it can be used as is.The final regex string is: #\\w+ (one or more letter with a # right before.)The tokenize method “Split to rows” creates a new row for each hashtag found.We are going to use the split to rows method for 2 reasons:- We don’t exactly know how many hashtag are there in each string, and we can’t choose a number of columns for the split to columns method… and we also don’t want to read each string to count how many hashtag we have.
- Our final table is a list of hashtags, so the split to rows creates the list. If we want to study how many times each hashtag is referenced, we need to count the hashtags.
If we want to study how many times each hashtag is referenced, we need to count the hashtags.Summarize data grouping by id_str and text.And count the text field. The result:To calculate the totals of each hashtag, we’ll have to shape the data differently. This means preparing the cross tab separately and in the end we will join everything together. This requires us to split our workflow into 2 different ways.Let’s start with the cross tab table. We can just use the Cross Tab Tool.The Cross Tab Tool allows us to turn columns into rows.We have to choose which fields will be our Header Field (the labels of the columns) and which field will be our data field (the data inside the table).We also have to choose a method to join data in the data field.Our header is the id_str field and the data is the count field we created with the summarize tool.The method is Sum, because we are handling with numbers and we want to find the frequency.There is also an option to group the data. We need to group by text, in order to get our list of hashtags.The result is a table like this:Now we have 2 problems:- We have to replace the Null fields with 0
- The Cross Tab Tool has renamed the id_str fields leaving only the numbers. The column 3 is supposed to be id_str_3.
We can use a Multi Field Tool to replace the Null values in each numeric field.While the Formula Tool allow us to choose only 1 column, the Multi Field Formula allow us to choose one or more columns and perform the same formula/expression everywhere.We are going to flag all the numeric field, manually or choosing Numeric from the drop down menu.The formula is: IF Isnull([_CurrentField_]) THEN 0 ELSE [_CurrentField_] endifIf a cell has a null value, replace it with 0 - else return the real value of the cell.Now we have to clean up our ID fields.Let’s drag and drop a Dynamic Rename tool from the Developer tab to the canvas.We need a formula to fix the column labels. Choose Formula from the drop down menu and select all the field that need to be renamed.We have to add the missing string before the number: 'id_str_'+[_CurrentField_]Now we can create our totals. Drag and drop a Summarize tool to the canvas and connect the first Summarize tool we used earlier to the new Summarize tool.We only need to group the data by text and sum the count field. We can also rename the Sum_Count field in Total, directly in the Summarize tool. We have 2 tables with 8 rows and the same hashtag in the text column. We can join the tables using the Join Tool and using the field text as common field:and Voila-- our tweets and totals!