

2 March 2015
With Tableau version 9 now in beta and due for release in the not-too-distant future, there's a lot of buzz in the Tableau community about all the new headline feature enhancements, and there are quite a few to shout about! New features like parallel processing are set to deliver massive performance improvements, while the new level of detail calculations will make once complicated table calculations child's play.But there are also dozens of little enhancements that haven't necessarily made the headlines, and that's what I want to talk about in this post. Here at The Information Lab HQ we've been testing (and playing) with the beta versions of Tableau Desktop v9 for a few weeks now, and I've put together a list of 10 little-known improvements in v9 Desktop that we think are pretty cool, and will almost certainly bring joy to the Tableau enthusiast and save them lots of time and effort. So now, in no particular order....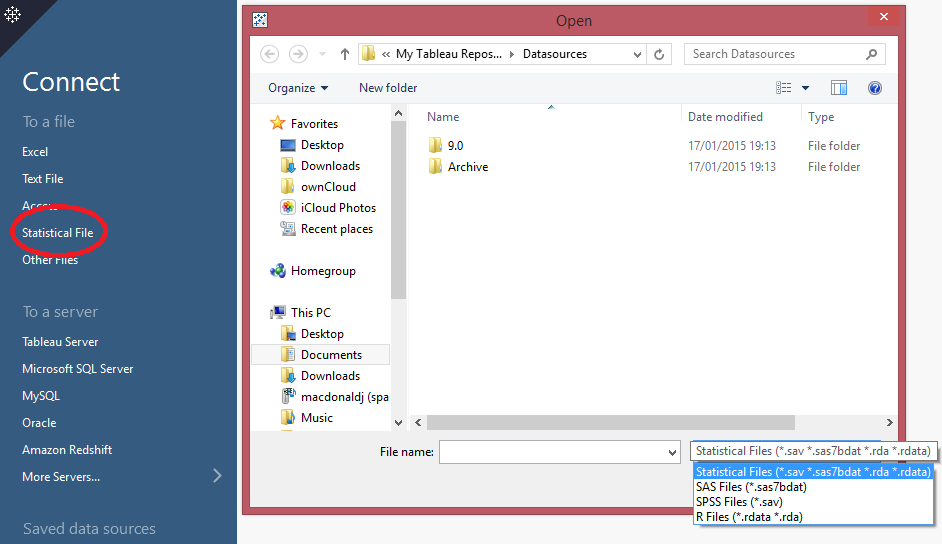
 So that's the list! I hope you enjoyed it. For those of you who are also testing the v9 beta, I'd love to hear what other neat little enhancements you've found, aside from the big headline innovations. Do feel free to share in the comments section, I bet we could come up with another list of 10 or more!
1. Direct connector for stats package files - SAS, SPSS, R
Got stats files that need visualising in Tableau? This new connector brings native support for a number of statistical package files including:.sas7bdat - the file format used by SAS.sav - the binary file format used by SPSS .rdata, .rda - the file formats employed by the R statistical analysis package2. Updated colour window with hex values and colour picker
The new and improved colour palette dialogue box now allows you to specify and see hex values for all the colours you're using - very handy for putting together those custom colour palettes, and what's more you can now also pick a colour from anywhere on your desktop and drop it into the palette. Very cool!3. The little arrow to the right of the new calculation window
We were a little worried at first at the minimalism of the new calculation window. I mean, where did all our drop-down menus go allowing us to choose what function to use? Well, now that the new calculation window auto-completes your typing with suggested dimensions, measures and formulas, you could argue that these aren't really necessary any longer. But wait, what's that little arrow off to the right of the window? Click it, and voila, you get your formula drop-down, complete with explanations and a usage example. It's a nice way to keep the interface clean while still giving you the option to search the formula list. While we're on the subject, don't forget to check out some of the new calculations introduced in v9, like the RANDOM(), HEXBIN, and REGEXP functions. One thing I would say is missed in this new version is the hyperlink out from that calculation window to the formulas help page on the Tableau site. If there are any Tableau devs listening, maybe you could reintroduce that before the release?4. The new 'Split' function
Why, hello, text to columns for Tableau. What typically used to be a job for Excel, SQL, or a calculated field of LEFTs and RIGHTs has now been made a one-click operation in Tableau. Just right-click on the dimension you want to split, navigate to the new 'Transform' menu and click Split. Tableau will automatically try to figure out the delimiter and split the data accordingly, but you can also choose Custom Split and specify the delimiter yourself if you like. So, who can tell me the most popular first name in Superstore Sales? Answers in the comments section below please, or you can tweet me.5. Hovering over sheet names when creating a dashboard or story reveals a thumbnail of the sheet
How many times have I sat there trying to remember what I named each sheet so I can navigate or add it to a dashboard quickly? This small, simple but incredibly useful feature shows a thumbnail of the sheet itself when you hover your mouse over the sheet names. This works both in the sheet list when creating a dashboard, and also when hovering over the sheet and dashboard names along the bottom of the Tableau Desktop window. That's a huge time saver, thanks Tableau!6. The new 'Tableau Discover' side menu on the start page
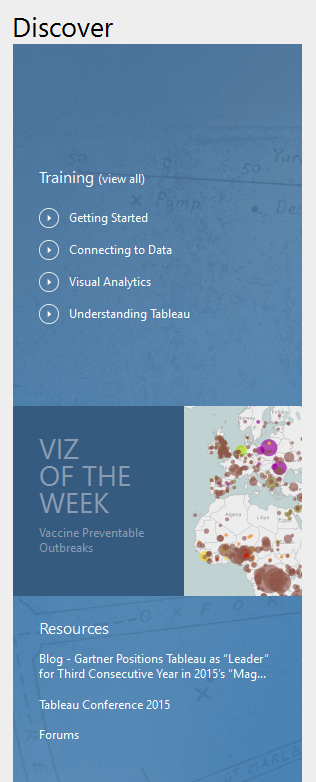
When you open Tableau v9 for the first time you'll now notice a new menu on the right that alerts you to a bunch of handy Tableau resources, including links to training for beginners, a highlight section on the Tableau Viz of the Week. Hang on, Week? What happend to Viz of the Day? Will Tableau choose one of the VotD's as their VotW's to appear on everyone's Tableau Desktop? Is there some other Viz competition I don't know about? Guess we'll have to wait and find out about that one. Further down towards the bottom of the Discover pane, you'll find links to other resources like the forums, recent Tableau blog posts and Tableau Conferences. What would be really cool here is to allow customers to customize this pane with their own links to internal resources, like corporate templates or colour palettes, internal user groups etc. One for the Ideas page? I think so!7. The new 'Press to Tableau' button in the top left
Tableau now includes a handy (what I like to call) 'Press to Tableau' button in the top left of the menu bar, which allows you to quickly flip between your viz and the Tableau Desktop start page. Previously this button was hidden away in the top right corner along with some other tabbed buttons, and I always found it really hard to position my mouse over it because they were so small (keyboard shortcut, anyone?) This will be another handy little time saver for sure.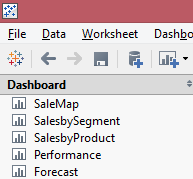
8. The 'Add New Data Source' button drop-down menu
Really loving this one. Clicking on the add new data source button in the menu bar now reveals a drop-down menu, which allows you to really quickly connect to a new data source, without having to navigate to another page. I think that's about 3 mouse clicks saved, which is huge when you're 'in the flow' of building your visualisation.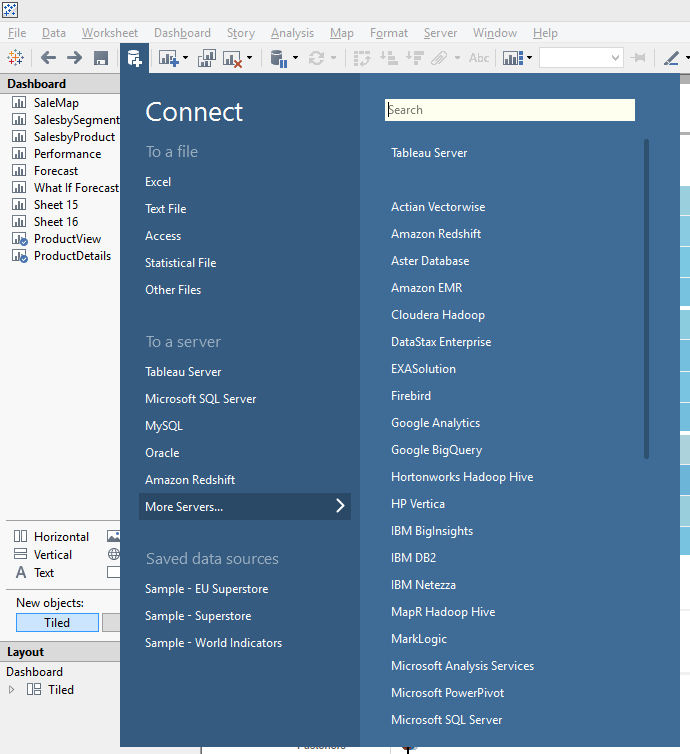
9. Tooltips stay shown until you move your mouse, rather than dropping off after a few seconds
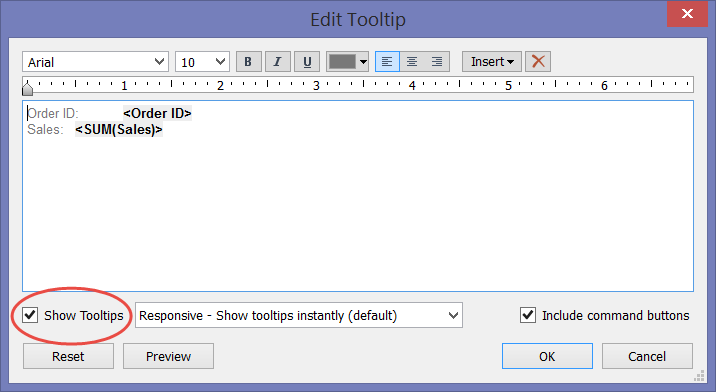
In current versions of Tableau, a tooltip only stays alive for 8 seconds and then it disappears. Don't believe me? Don't take my word for it! Now in Tableau v9, tooltips stick around for as long as you leave your mouse in place. Furthermore, tooltips are now super responsive, populating with new data for whichever mark you're hovering over in real-time. And if you don't like this, there's even an option to disable it in the tooltips window (see the picture in no. 10)
10. The tooltip window now has a 'Show tooltips' tick box
Staying on the same theme, tooltips now have an on/off switch, yay! I can think of many times when I didn't want to show a tooltip on a particular sheet in a viz, and I ended up having to manually delete all the text in the tooltip box, but even then this doesn't get rid of the Ubertip, so I then had to look at overlaying the sheet with a blank, or text box. This will save absoutely tons of time during the build process, well done Tableau!Edit: Thanks to Matthew Lutton for pointing out that deselecting the Show Tooltips tickbox doesn't actually get rid of the Ubertip. As a workaround, you could look at following the above trick of overlaying a blank floating box on top of your viz.So that's the list! I hope you enjoyed it. For those of you who are also testing the v9 beta, I'd love to hear what other neat little enhancements you've found, aside from the big headline innovations. Do feel free to share in the comments section, I bet we could come up with another list of 10 or more!